January 05 2022
Navigating YouTube Analytics
YouTube is the dominating video hosting platform in the world. When you are ready to start publishing videos, it’s a good idea to familiarize yourself with the analytics dashboards available. Below is a quick overview of how to navigate through the main dashboard.
The Channel Dashboard
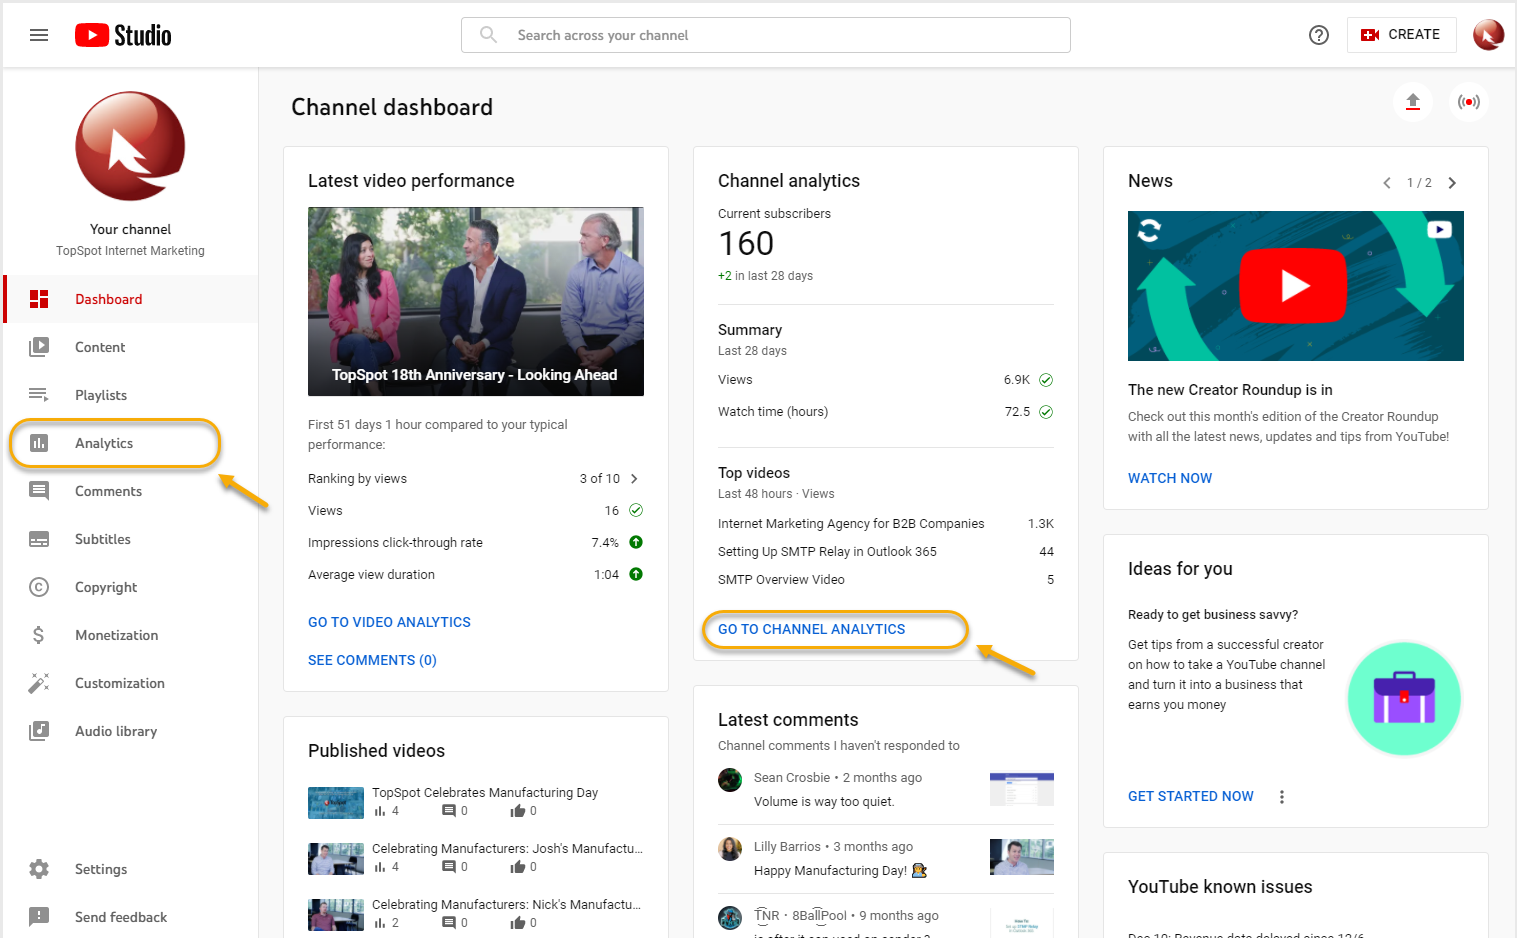
The YouTube Channel Analytics dashboard provides a high-level overview of the analytics for your YouTube videos and your YouTube channel to help you better understand and analyze how your videos are performing. To find this dashboard, click on the Your Videos link in the left-hand menu and then Dashboard.

Within this dashboard, you can view how your latest video is performing in terms of ranking, view count, click-through rate (CTR), and average view duration. Additionally, this dashboard also shows a summary of your overall YouTube channel’s analytics, your published videos, the latest comments on your videos, as well as tips and tricks from YouTube on how to better customize and optimize your channel.
Channel Analytics
Dive deeper into your YouTube channel’s analytics through the Channel Analytics dashboard which can be accessed one of two ways: click on the Analytics tab on the left-hand menu, or you can click on the Go To Channel Analytics link in the right window.
Within the Channel Analytics dashboard, the Overview tab shows you the summary analytics for your YouTube channel. These metrics include the total number of views, watch time (hours), and subscribers that your channel has accumulated. You can use these metrics to get a gauge on how your channel is performing, identify any trends that you see, and determine what is working and what is not among your videos.

The right-hand side of the dashboard shows your YouTube channel’s view count and subscriber count update in real-time, as well as your top-performing videos within the time range you have set. By default, this time range is set to the last 28 days.
You can adjust the time range in which you want to view by going to the upper right-hand corner of the dashboard and choosing one of the different presets for your time range.

To dive even deeper into your channel’s analytics, click on either the See More link below the chart or the Advanced Mode link in the upper right. This will pull up the Advanced Mode reporting page where you can generate a custom, downloadable report with the metrics of your choosing.

Advanced Mode Report
Within the Advanced Mode reporting page, you can analyze metrics for your channel or specific videos using the customizable graph and table. You can choose what columns you want to appear on your table depending on the metric you are analyzing. Additionally, this reporting tool has multiple categories of metrics that can be measured along the top of the graph including Video, Traffic Sources, Geography, Viewer age, etc.

Utilizing the Compare To button at the top right corner of the report, you can also measure multiple videos at the same time to compare how each video is performing.
What This Means for You
Now that you know how to navigate YouTube’s Analytics platform, you can explore the metrics that will help you to better create videos that appeal to your target audience. Stay tuned for a look at understanding YouTube’s specific metrics, such as what constitutes a View, Impressions, and more.
Interested in creating a new company overview video or an insider’s look at how your products are made? Contact us to learn more about our corporate and industrial video production services.