February 28 2022
YouTube Analytics – Step-by-Step Guide
In Navigating YouTube Analytics, we went over the basics of how YouTube presents its analytics data regarding your Channel on the Channel Dashboard. Now we will go into further detail by exploring the different tabs within that dashboard and what YouTube means by the terms they are using.
Video Analytics – Overview Tab
When analyzing a video on your YouTube channel, you can view metrics specific to that video within the Video Analytics dashboard. Within the Overview Tab, you can measure Views, Watch Time (hours), and Subscribers to your Channel from that specific video.

Views – The number of times your video has been watched, including repeat views from the same person.
What counts as a view?
- A user must intentionally initiate the watching of a video, and
- The user watches it on the platform for at least 30 seconds, and
- Views don’t count for videos embedded in a page that auto start when that page is loaded
Watch time – The cumulative amount of time people have spent watching this specific video.
- Watch time is an important metric to track because watch time is a key ranking factor in the YouTube algorithm. Videos with higher watch time are more likely to appear higher in search results and in the recommended/suggested video sections
Subscribers – The number of people who subscribed to your Channel after watching this specific video.
Video Analytics – Reach Tab
The metrics within the Reach Tab can be analyzed to give you a better understanding of where and how people are finding your content.

Impressions – The number of times the thumbnails for your videos were shown to YouTube viewers.

Impressions Click-Through-Rate (CTR) – The percentage of people who clicked on a thumbnail on YouTube to view your videos.
Views vs Unique Viewers – When it comes to differentiating views from unique viewers, views refer to the number of times a video has been watched, even repeat views from the same person. Unique viewers refers to the total number of different individuals who watched your video over a given period. YouTube uses IP addresses to identify whether that viewer is a unique viewer or not.
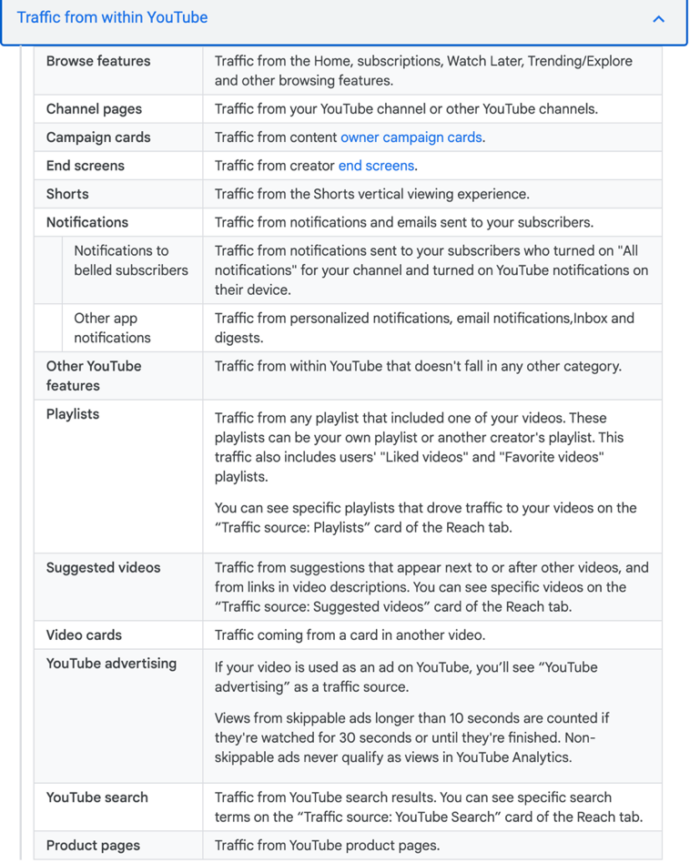
Traffic Sources for YouTube Videos
Traffic Sources refers to where and how people are finding your videos. Within the Reach Tab, you can analyze different traffic sources including traffic source types, traffic from external websites and search engines, keywords/phrases used by the user to search for your video, and traffic sources from suggested videos and playlists. This is important because the success of your video can also be seen in the various sources from which it is found.
Traffic to your videos can come from one of two sources: from within YouTube or external sources. Traffic sources from within YouTube include:
External traffic types include:
External – Traffic from websites and apps that have your YouTube video embedded or linked to. You can see specific external sites and sources on the “Traffic source: External” card of the Reach tab
Direct or Unknown Sources – Traffic from direct URL entry, bookmarks, signed-out viewers, and unidentified apps.
Video Analytics – Engagement Tab
The Engagement tab gives you an overview of what your audience is watching and how they’re interacting with your content.

Average View Duration – Estimated average minutes watched per view for the selected video and date range
Why is Average View Duration important?
- Measures your video’s ability to engage viewers
- Whether you’re trying to sell a product, sell a service or simply achieve greater brand recognition with a particular video, tracking its average view duration can help.
- If the video has a low average view duration, it means viewers are disengaged.
Audience Retention for YouTube Videos
Audience retention measures how many viewers are still watching your video during your video playback. It also shows you when your audience stopped watching or are not engaging with your video which gives insight into areas of your video that are working well and opportunities for improvement.
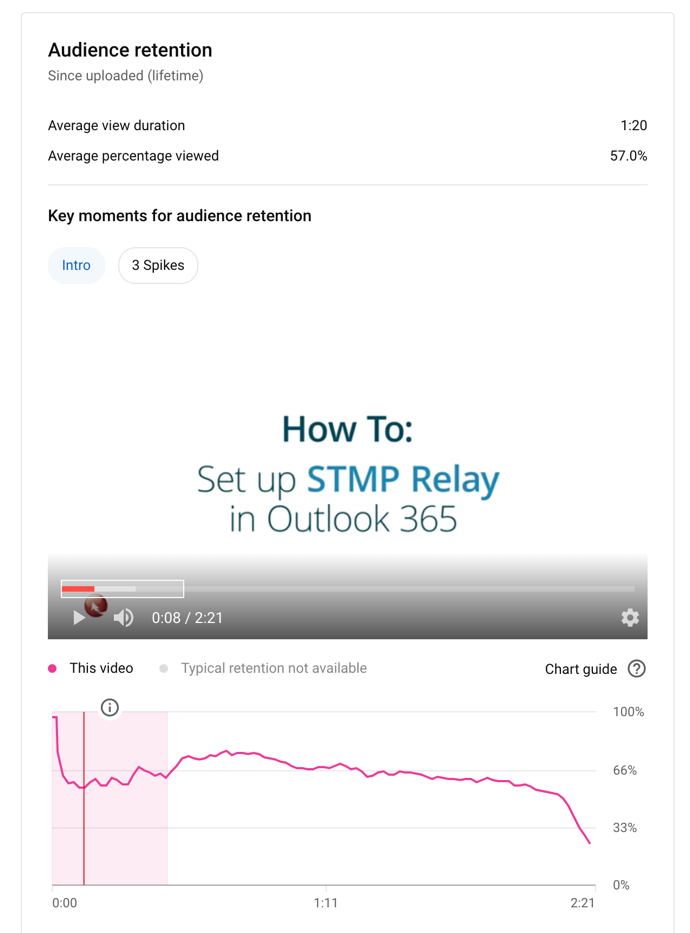
Key Moments for Audience Retention for YouTube Videos
Analyzing the key moments within your videos can give you an understanding of which parts of your video are engaging to viewers and which parts cause users to be disengaged.

There are four types of key moments with the Audience Retention report:
Intro – The percentage of your audience that is still watching your video after the first 30 seconds
Top Moments/Continuous Segments – Moments in the video where viewership remained consistent.
Spikes – Moments in your video that had increased retention from viewers. Typically, this is the result of a viewer re-watching that specific moment of the video
Dips – Moments in your video that were either skipped or moments where viewers stopped watching your video completely. This is typically the result of viewers skipping that section of the video or if they have stopped watching the video altogether.
For more help with understanding YouTube Analytics, read Navigating YouTube Analytics. To see how these various metrics can be read to show you a complete picture of your video viewership, read Understanding the Data – YouTube Case Examples.
Tags: analytics, videos, YouTube